
 Ministry of Environment, Urbanisation and Climate Change
Institutional support
 COP31 Türkiye · Antalya
9–20 November 2026 · Host conference Piri Reis University · COP31 Türkiye academic and technical lead

Global Ocean & Maritime
Data Governance Platform
Explore ocean, climate, energy and maritime data together. See the source platform, original producer, actual coverage and proposed AI use of each dataset.
Computed results and analysis tools
SST counts use the latest import per dataset. Each map layer represents one region and one complete annual (January–December) period. Derived results and method definitions are not added to the data-record count above. Proposed uses are not implemented models.
Explore results in AI Lab →Follow the data to its origin.
Source → dataset → coverage → original producer → AI use proposal. Open a dossier to see the evidence and its limits.
The tour is one recording of the running platform, split into 63 chapters. It loads only when you ask for it.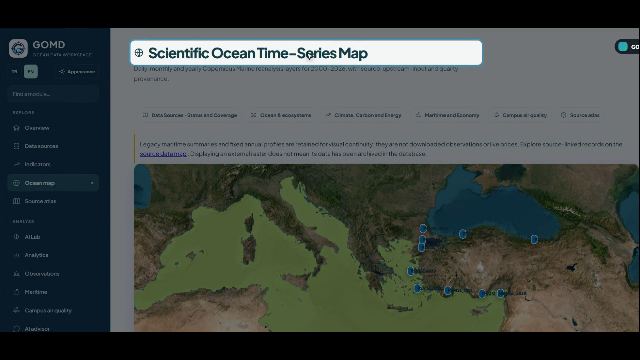
All Interactive Maps & Global Atlases in GOMD
Launch every interactive oceanographic, meteorological, satellite precipitation, marine heatwave, maritime chokepoint, and institutional indicator map directly from a single spatial hub.
4D Scientific Ocean Time-Series GIS Map
Interactive Copernicus Marine L4 reanalysis layers (SST, Salinity, Ocean pH, spCO₂, Chlorophyll-a, Dissolved Oxygen, Nitrate), GEBCO Bathymetry, and verified station beacons.
Global Sea Surface Temperature (SST) & Marine Heatwave Atlas
Smooth-interpolated thermal raster canvas displaying mean SST (°C), 1991–2020 climate anomalies, strong marine heatwave (MHW) days, and record-breaking ocean cells.
World Precipitation Atlas · CHIRPS v3 + Wind Streamlines
High-resolution 0.05° (~5 km) global land precipitation grid combined with live animated ERA5 10m wind streamlines, sea-level pressure isobars (hPa), and city queries.
Global Ocean & Land Reanalysis Atlas · ECMWF ERA5
Full global 90°N–90°S ocean and land precipitation reanalysis (0.25°) coupled with 10m wind vectors and synoptic pressure centers (H/L) back to 1940.
Global Satellite Precipitation Map · NASA GPM IMERG
NASA Global Precipitation Measurement (GPM) multi-satellite 0.1° (~10 km) gridded rainfall fields across open oceans, coastal zones, and continents.
3-Hourly Global Precipitation, Storm & Lightning Forecast Map
Interactive 3-hourly global precipitation forecast (DWD ICON / Open-Meteo), EUMETSAT MTG-I1 LI & NOAA GOES GLM lightning flash density, and storm alert badges.
Global Maritime Chokepoints, Cape Diversion & Bunker Ports Map
Spatial GIS overlays for IMF PortWatch maritime chokepoints, Red Sea / Cape of Good Hope diversion corridor, global VLSFO/MGO bunker hubs, and Turkish Straits traffic.
Institutional Data Source & Country/Station Indicator Atlas
Explore all 119 institutional sources and 878 indicators across country choropleth polygons, oceanographic buoys, tide-gauge stations, and biodiversity occurrence points.
Daily Sea Surface Temperature (SST) & Marine Heatwave Pulse
Interactive 45-year climate spaghetti trajectories, 1991–2020 climatology baseline, thermal anomalies, and verified 4D spatial raster layers.
Loading verified data…

Method, scope and sources
These are GOMD calculations from NOAA OISST. They are not reproductions of Mercator’s published numerical results. Regional boxes are not official basin or maritime boundaries. Surface only: depth is not animated.
Reference chart types · Mercator Ocean · Hobday MHW| Country / Global Region | First Record | 2000 | 2010 | 2020 | Latest Record | Historical Change |
|---|
⚙️ Direct Export to Engineering & Oceanographic Software Suites
Beyond Python and R, marine, coastal, and offshore engineers rely on specialized hydro-morphodynamic, spectral wave, GIS, and offshore structural suites. Select a software package below to export verified GOMD boundary conditions and scripts with one click.
MATLAB Ocean & Coastal Return-Period Toolkit (.m)
Physical oceanographers and coastal engineers use MATLAB for spectral wave analysis (JONSWAP), Gumbel 50/100-year return period design, and harmonic tidal analysis. Download a ready-to-run .m script with embedded GOMD time-series and live webread() connector.
% MATLAB Live Connection to Piri Reis University GOMD
url = 'https://gomd.pirireis.edu.tr/dataset_api.php?action=series&indicator=copernicus_med_sst_c';
resp = webread(url);
% Gumbel 50-Yr & 100-Yr Coastal Design Return Level
beta = (sqrt(6) * std(vals)) / pi;
u    = mean(vals) - 0.5772156649 * beta;
X_100yr = u - beta * log(-log(1 - 1/100));Delft3D Hydrodynamic Boundary Condition File (.tim)
Coastal and estuary engineers use Deltares Delft3D and SWAN to simulate sediment transport, harbor agitation, and thermal plume dispersion. Export GOMD series directly as a Delft3D .tim boundary file (minutes since reference epoch vs. parameter value).
* Deltares Delft3D-FLOW Boundary Time-Series (.tim)
* Source    : Piri Reis University GOMD
* Column 1  : Time [min] since Reference Epoch
* Column 2  : Boundary Value [degC / m]
          0.00        21.450000
525600.00 21.620000DHI MIKE 21 Non-Equidistant Calendar ASCII Series (.dfs0.txt)
DHI MIKE 21 (HD, SW, ECO Lab) is the industry standard for coastal structures, marine outfalls, and shoreline evolution. Export GOMD observations formatted for immediate import into MIKE Zero Time Series Editor (dfs0).
# DHI MIKE Zero / MIKE 21 ASCII Time-Series Export
# TimeAxis : Non-Equidistant Calendar Axis (UTC)
Timestamp_UTC         Entity_Code  Value      Quality_Flag
2024-01-01 00:00:00   MED          21.840000  verified
2025-01-01 00:00:00 MED 22.110000 verifiedOcean Data View (ODV) Generic Spreadsheet (.odv.txt)
Marine scientists and chemical/biological oceanographers use AWI Ocean Data View (ODV) for DIVA gridded property-property plots, T-S diagrams, and vertical hydrographic sections. Download GOMD data in native ODV Generic Spreadsheet format.
//<Creator>Piri Reis University GOMD</Creator>
//<DataField>Ocean</DataField>
Cruise    Station  Type  mon/day/yr  Longitude  Latitude  Value
GOMD_PRU MED B 01/01/2025 30.0000 36.5000 22.11000QGIS & ArcGIS Pro Spatial FeatureCollection (.geojson)
Marine spatial planners (MSP), hydrographic surveyors, and environmental engineers use QGIS and ArcGIS Pro. Download OGC-compliant GeoJSON layers with station coordinates, min/max/mean statistics, and ISO-19115 provenance.
{
  "type": "FeatureCollection",
  "crs": { "type": "name", "properties": { "name": "urn:ogc:def:crs:OGC:1.3:CRS84" } },
  "features": [{ "type": "Feature", "geometry": { "type": "Point", "coordinates": [30.0, 36.5] } }]
}Offshore & Naval Architecture Metocean Forcing Table (.csv)
Naval architects and offshore engineers use OrcaFlex, ANSYS Aqwa, and DNV Sesam for mooring line dynamics, subsea pipeline stability, and hull seakeeping. Export structured Metocean forcing tables directly from GOMD.
Period,Entity_Code,Latitude_degN,Longitude_degE,Indicator_Key,Observed_Value,Unit,Quality_Flag
2024-01,MED,36.5000,29.0000,copernicus_med_sst_c,21.84000,"degC",verified
2025-01,MED,36.5000,29.0000,copernicus_med_sst_c,22.11000,"degC",verified
FROM SOURCE TO DATASET
See where the data comes from.
Explore institutions, then inspect each dataset’s coverage, original providers and usage conditions.
Hover, focus or tap a source. Click a dataset to open its full record.
Keyboard: press Enter or ↓ on a source to reach its datasets; Esc returns to the source.
SOURCE → DATASET → RECORD
Datasets and series
A catalogue entry does not mean the full dataset has been downloaded or used by an AI system. Distributor and original producer are shown separately. Counts reflect this installation only: each indicator is one catalogue entry and may contain several geographical series, and imported selections are not the complete archives of their providers.
Modules
Explore enterprise tools built for scientists, policy makers, maritime fleet operators, and blue economy financiers.
4D Scientific Ocean Time-Series GIS
2000–2026 Copernicus Marine Service L4 reanalysis raster layers. Interactive time-slider, point query probe, physical anomaly detection (pH, temperature, oxygen, spCO2).
Launch 4D Map →IMF PortWatch & Maritime Intelligence
Explore daily vessel activity and AIS-based capacity estimates at selected maritime chokepoints. Check imported dates and coverage in each source record.
Explore Maritime Module →Ocean Scenarios & AI Analysis
Explore scenario calculations and AI-assisted interpretation. New dataset dossiers explain proposed inputs, calculations and limits; these are not yet automatic model connections or validated climate forecasts.
Explore Scenario Tools →Blue Finance OS & Grant Radar
Horizon Europe, GEF, World Bank, EIB, and Climate Fund matching engine. Automated consortium builder, application factory, and MRV verification.
Open Blue Finance OS →FAIR Telemetry & Physical Sensors
Distinguish station observations, satellite products, model grids and statistics. Inspect quality flags, source links and access conditions, including the featured campus station.
View Observation Data →AI Policy Brief & Decision Engine
Automated synthesis of regional marine health data into executive policy briefs, ministerial summaries, and SDG-14 compliance reports.
Generate Policy Brief →AI Lab
Fit trends to an observed series, test whether they are real, and project a stated scenario with its uncertainty. Fifteen advanced methods — stationarity tests, ARIMA and seasonal ARIMA, wavelet, extreme value return levels, cointegration between two series — each stating why it does not apply when it cannot run. Every figure is computed locally.
Open the lab →
Python gomd SDK (v2.0.0)
52/52 Functions · Google Colab & Jupyter
Streams live GOMD SQL series into pandas DataFrames for TEOS-10, Marine Heatwaves, Lueker pCO₂, FuelEU Maritime, and Synthetic DiD.
💻 Show Python Install & Quickstart Code
!pip install -q -U https://gomd.pirireis.edu.tr/sdk/dist/gomd-2.0.0-py3-none-any.whl
import gomd; gomd.cite("all")
c = gomd.GOMDClient()
co2 = c.analyze_gomd_series("gml_mauna_loa_co2_ppm", "WLD")
R gomd Package (v2.0.0)
44/44 R Functions · RStudio & Posit Cloud
Pulls live GOMD series and multi-country panels into native R data.frames for Mann-Kendall, TEOS-10, IMO CII, and Synthetic DiD.
💻 Show R Install & Quickstart Code
install.packages("https://gomd.pirireis.edu.tr/sdk/dist/gomd_2.0.0.tar.gz", repos=NULL, type="source")
library(gomd); gomd_cite("all")
res_co2 <- gomd_analyze_series("gml_mauna_loa_co2_ppm", "WLD")
res_med <- gomd_analyze_basin("OCN_MED_LEVANTINE")🎯 Institutional Packages & Specialized Features (Gated Access)
GOMD Enterprise Tier unlocks mission-critical, secure, and password-protected capabilities tailored specifically for fleet operators, government ministries, blue finance institutions, and scientific researchers.
Integrated Workflow Studios for Institutions
See it working
One recording of the running platform, from the first screen to the last: a source chosen, a series charted, a model fitted, a fund matched, a brief drafted. Nothing is a mock-up. Nothing loads until you press play.
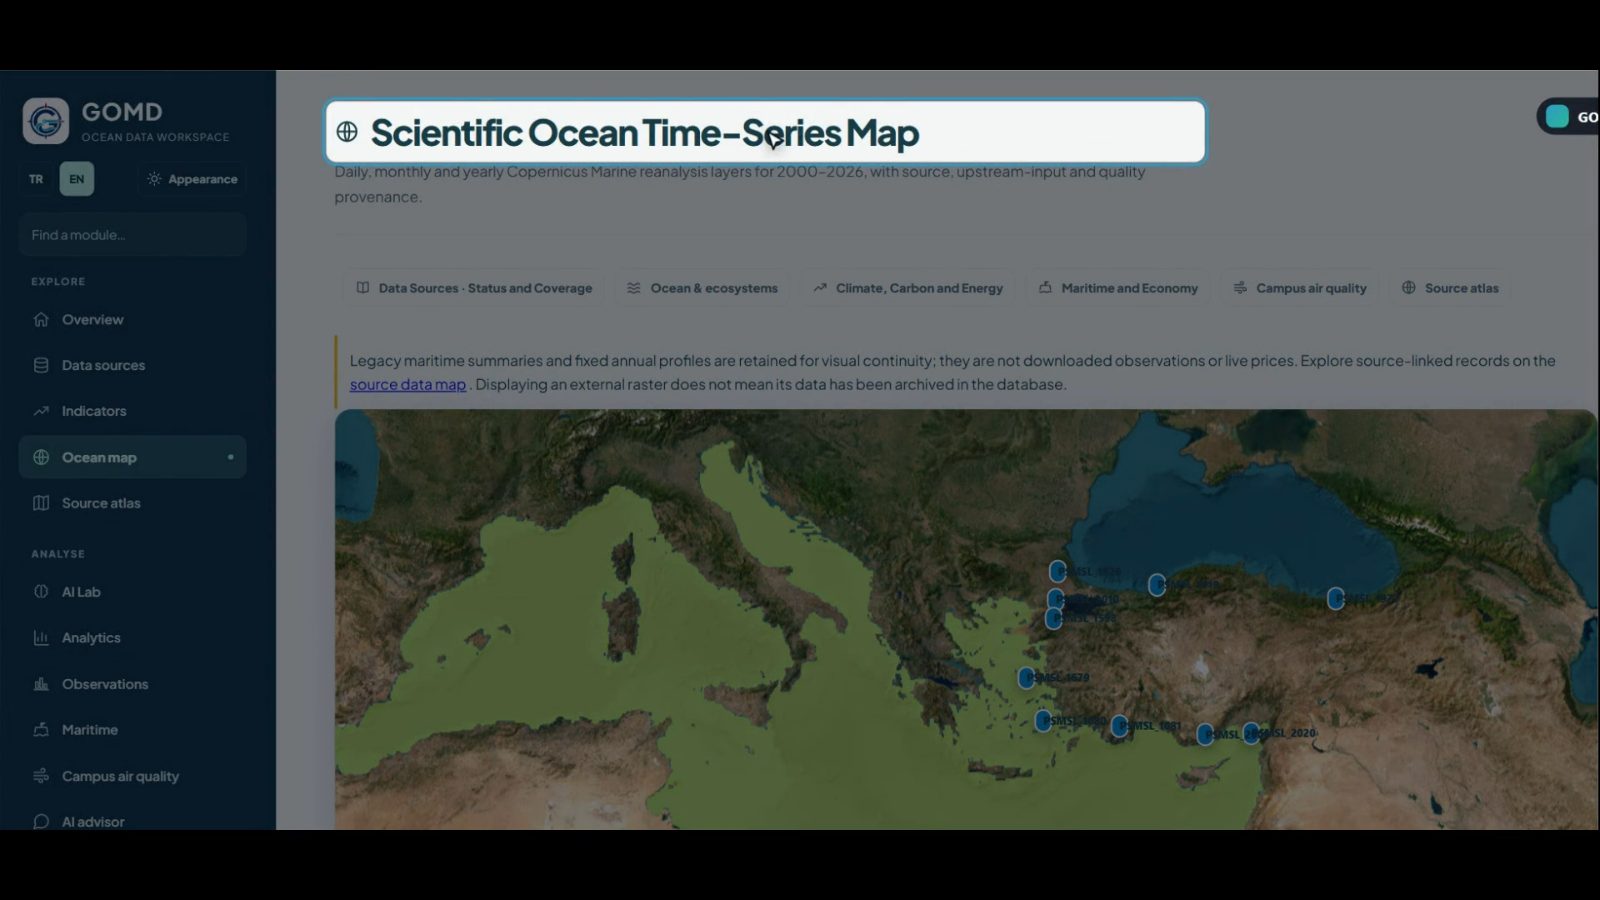
Recorded from this installation against the live catalogue. The recording has no soundtrack — the narration runs as captions inside the picture, in English. Figures on screen are whatever the database held at the time of recording. Download the file
Dataset Catalogue, JSON API & Official SDKs
Read source metadata, coverage, time-series and spatial layers directly with the official Python (gomd) and R (gomd) packages or cURL.
# 1) Python SDK v2.0.0 — Connect to GOMD Server, Pull Live Series & Run Scientific Models
pip install gomd --extra-index-url https://gomd.pirireis.edu.tr/sdk/dist/simple/
python -c "import gomd; c = gomd.GOMDClient(); print(c.analyze_gomd_series('gml_mauna_loa_co2_ppm', 'WLD')); print(c.analyze_gomd_basin('OCN_MED_LEVANTINE'))"

# 2) R Package v2.0.0 — Fetch Live GOMD Series into R data.frame & Run Econometric / Ocean Models
R -q -e 'install.packages("gomd", repos = "https://gomd.pirireis.edu.tr/sdk/dist", type = "source")'
R -q -e 'library(gomd); df <- gomd_get_series("gml_mauna_loa_co2_ppm", "WLD"); str(gomd_analyze_basin("OCN_MED_LEVANTINE")); gomd_cite("apa")'

# 3) REST JSON API (cURL — Catalogue, Indicator Dossier & Live Observation Series)
curl -s 'https://gomd.pirireis.edu.tr/dataset_api.php?action=catalog'
curl -s 'https://gomd.pirireis.edu.tr/dataset_api.php?action=series&indicator=gml_mauna_loa_co2_ppm&entity=WLD'COP31 Türkiye Ocean & Climate Vision
Strengthening ocean governance across the Mediterranean, Aegean, Marmara, and Black Sea basins under the UN Decade of Ocean Science.
- Dates and venue
- 9–20 November 2026 · Antalya EXPO
- Ocean day
- 17 November · Ocean, Seas, Nature and Land Use
- Next
- COP31 pre-sessional week · Antalya · 2–8 November
- Roles
- Türkiye hosts and presides · Australia presides over negotiations
Regional Data Diplomacy
Creating shared cross-border ocean observation networks and harmonized marine ecological standards across 24 regional partner countries.
SDG-14 Target Tracking
Real-time scientific tracking for SDG 14.1 (Eutrophication & Plastics), SDG 14.3 (Ocean Acidification), and SDG 14.a (Marine Research Capacity).
Decarbonization MRV
IMO 2030/2050 and EU ETS maritime carbon compliance tracking, Green Corridor fuel transitions, and carbon offset MRV audits.
Who makes the platform possible
Academic leadership, institutional support, observers and the data provider institutions whose datasets the platform carries under their own licence terms.

🏛️ Show / Hide Data Provider Institutions (167 Institutions)
- Deutscher Wetterdienst 1.480.108.032
- UCSB Climate Hazards Center 1.123.981.254
- NASA GPM / USF IMaRS 946.012.392
- ECMWF / Copernicus C3S 106.586.337
- World Bank 369.801
- World Bank 254.089
- SOCAT 171.599
- Copernicus Marine 151.372
- IMF 145.032
- European Commission Joint Research Centre 126.170
- Copernicus C3S / ERA5 98.122
- United Nations Conference on Trade and Devel… 95.741
- NOAA PSL / NOAA NCEI 82.435
- Organisation for Economic Co-operation and D… 74.364
- Food and Agriculture Organization of the Uni… 69.837
- International Energy Agency 67.233
- Food and Agriculture Organization of the UN 46.029
- World Resources Institute 43.211
- Food and Agriculture Organization 38.683
- World Bank Changing Wealth of Nations 36.482
- World Health Organization 36.265
- US National Snow and Ice Data Center 33.949
- World Trade Organization 33.786
- European Commission Joint Research Centre 33.110
Partner with GOMD for COP31 Türkiye
Ministries, universities, research institutions, and maritime organizations are invited to integrate data streams, access the Blue Finance OS, or join scientific working groups.